Pie Preferences at The Pie Hole
A recent survey asked patrons about their preferences for Apple, Blueberry, and Cherry pies. The results provide interesting insights into the popularity of these classic flavors.
Survey Findings
Based on the responses, we found the following:
- Total People Surveyed: 80
- Enjoyed Exactly Two Types of Pie: 16
The breakdown of preferences is visualized in the Venn diagram below.
Venn Diagram of Pie Preferences
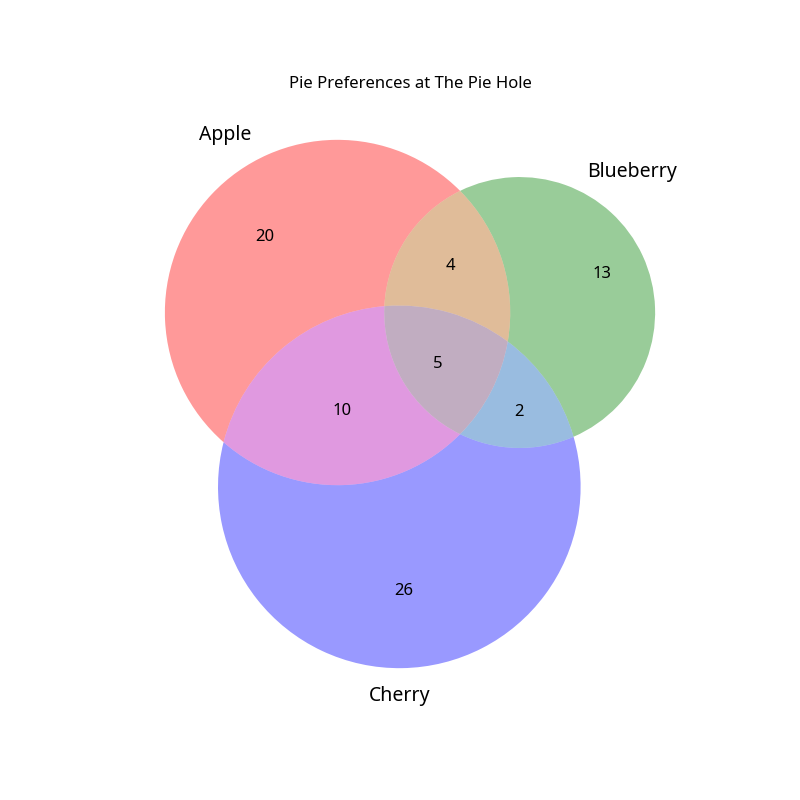
The diagram shows the number of people who enjoyed each combination of pies:
- Apple Only: 20
- Blueberry Only: 13
- Cherry Only: 26
- Apple and Blueberry Only: 4
- Apple and Cherry Only: 10
- Blueberry and Cherry Only: 2
- All Three (Apple, Blueberry, Cherry): 5